SIFMA’s U.S. Equity Market Structure Primer
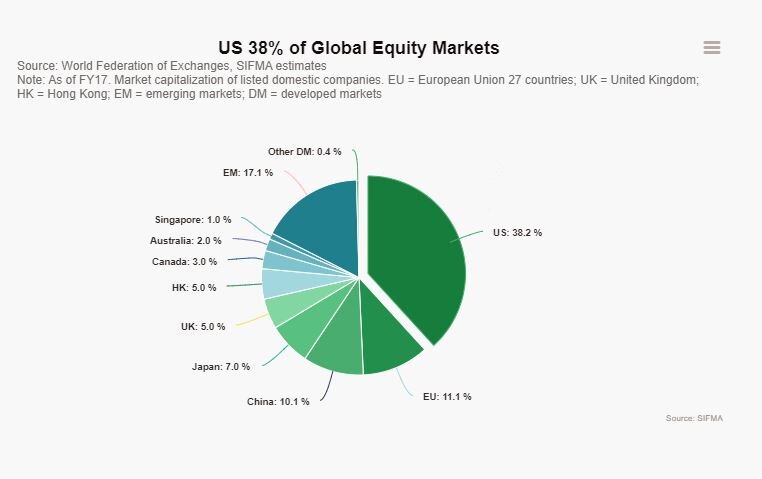
The U.S. equity markets are the largest in the world, representing around 38% of the $85 trillion in global equity market cap, or $32 trillion.
On average, around 6.7 billion shares are traded on U.S. equity markets every day. The U.S. equity markets continue to be among the deepest, most liquid and most efficient in the world, with investors enjoying narrow spreads, low transaction costs and fast execution speeds. There is also plenty of opportunity for price improvement, especially for retail investors.
That said, one can always strive to improve. Efficient and resilient market structure is key to sustaining investor confidence and participation underpinning the equity markets. The goal of regulators and market participants is to promote market resiliency and ensure the U.S. equity markets continue to benefit investors and play an essential role in capital formation.
The full equity market structure primer from SIFMA Insights is available here.
The equity market structure overview includes:
Drivers of Market Volumes
Evolution of the Market Landscape
Market Shares Across Exchanges and Off-Exchange Venues
Order Routing
U.S. Cash Equities and SROs
The Evolution of Equity Market Regulations
Where We Stand Today
The History of U.S. Stock Exchange and Market Events